We use cookies to improve your experience. By using this site, you accept our privacy policy.

Research / India / Last-mile logistics

Premium housing societies in big Indian cities get about three times the deliveries of the average home

Our estimate for FY26, from the latest data available, for India's cities of more than a million people: the average home gets 27-35 deliveries a day per 100 homes, counting parcels and quick-commerce and food orders. Premium housing societies get 58-118, two to four times as many, while ordinary gated societies sit only a little above the average. Food and quick-commerce riders, not parcel couriers, bring most of a premium society's deliveries.

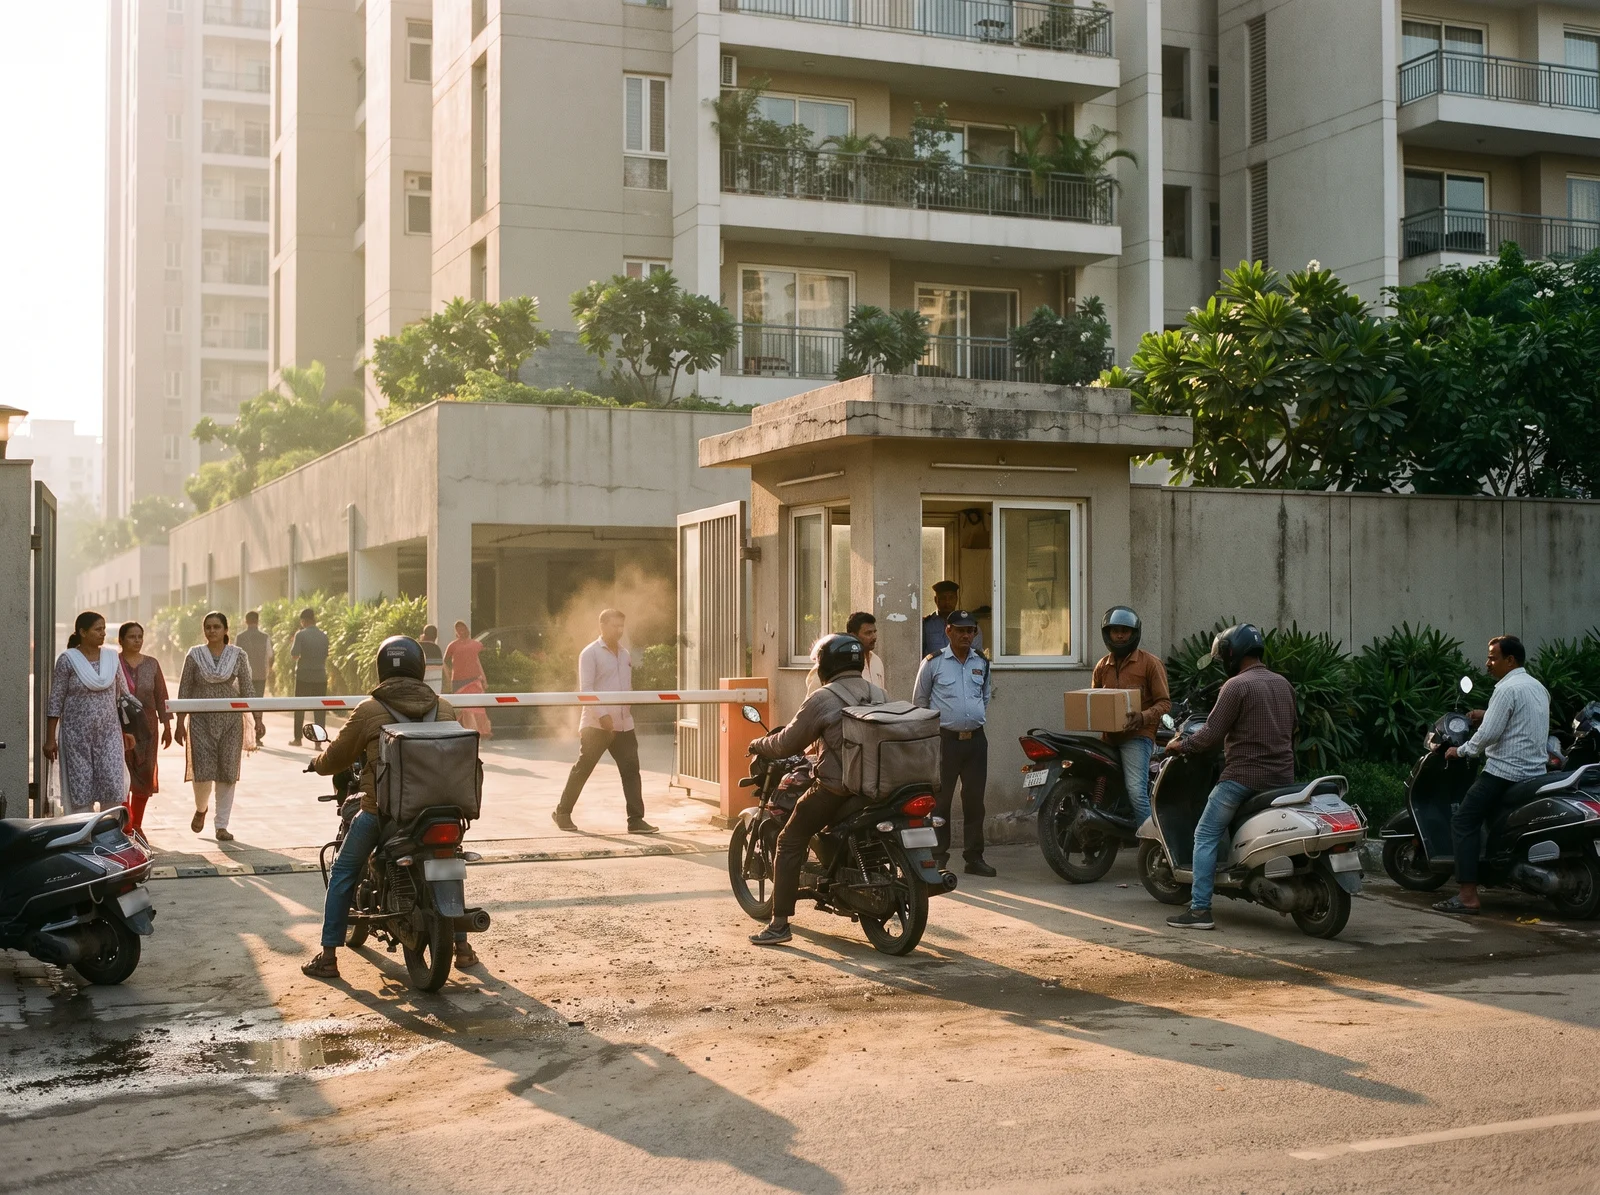
Peak-hour deliveries at a housing society gate.

India still ships more parcels than it delivers meals and groceries: about two parcels for every quick-commerce or food order in FY26, the financial year to March 2026 (1). Parcels come with couriers, who often carry several for one building; meals and groceries come with riders, the two-wheeler delivery staff of food and quick-commerce apps, who bring one order at a time and hand it over at the gate. But that national ratio is the wrong number for a developer in a big city. Riders are concentrated in big cities, while parcels go everywhere, and quick-commerce sales there more than doubled in FY26 (2). In big-city homes riders now roughly match parcels, and in premium societies they lead.

This article sizes what arrives at a home by kind of household, explains why the national picture misleads, and sets out what that means for a building's design. Every count is for FY26, from company figures where they exist; the national parcel count is Redseer's FY25 figure grown 20-30%, our assumption, explained under the first table (3). Figures we derived cite a source that reads "Our calculation" in the Sources list.

Deliveries depend on the kind of home

A national total divided by every household gives the average home, but orders are not spread evenly. Better-off households order far more, and many of them live in gated societies, the best-off in societies run through a community app such as MyGate or NoBrokerHood. Redseer, an Indian consulting firm, counts about 150,000 gated communities, with incomes five to seven times the national average (6). On its figures they hold about 40-45% of the households in India's top 50 cities by now (our calculation from its 2021 count) (7). It expects them to account for nearly 40% of India's online retail by 2031 (8). The app-managed societies reach 6-7 million homes, which MyGate itself describes as premium households: about 10-12% of the homes in these cities (6, 9). At the other end, about 15-16% of households in the million-plus cities lived in slums in 2011 (10). A national household survey in early 2025 shows how steep the gradient is: in these cities 70% of the best-off homes had bought goods online in the previous month, against 28% of the poorest 15% (11, 12).

Premium societies get about three times the deliveries of the average home (per 100 homes a day, FY26)

Kind of homeShare of homesAll deliveries Quick-commerce and food orders ParcelsHow we know
All homes, average100%27-3513-1814-17National totals
Premium, app-managed societies10-12%58-11833-6824-53Household survey (low end), MyGate (high end)
Standard gated societies28-35%26-4514-2412-21Household survey, by spending
Other flats and housesabout 40%14-267-138-14Household survey, by spending
Slums13-17%4-121-53-7Household survey, by spending
Sources: 4, 9, 12, 13

Every row except the average rests on a measurement: the National Sample Survey's 2025 telecom survey, which asked 2,424 households in these cities how many times they had bought goods online in the past month (11). Ranked by spending, homes order more the better off they are, and we read the rows off that gradient (12). The survey sets the shape, not the level: people recall fewer orders than they place, so the city totals set the level. Premium is the widest row because two measurements disagree. The survey stops at 30 orders a month and puts the best-off homes at about 58 per 100 a day. MyGate's chief executive reported 1.2 deliveries a home a day in its societies in 2019, about 120 (13). MyGate then covered about 2,500 communities, probably its best-off early users, and quick commerce had barely begun (13). The truth for a given society lies between. On this reading, ordinary gated societies sit only a little above the average; the survey records spending, not the type of home, so it cannot show whether the gate itself makes a difference.

A 100-home premium society gets about 24-53 parcels and 33-68 rider orders a day

24-53e-commerce parcels on a normal day, returns included (4)
33-68quick-commerce and food orders on a normal day (4)
53-143parcels on a festive peak day (5)

The estimates scale in proportion to the number of homes, so a 300-home society gets about three times the 100-home figures:

Daily deliveries scale with the size of a premium society

Society size Parcels, normal day Quick-commerce and food orders, normal day Parcels, festive peak day
100 homes24-5333-6853-143
200 homes (a typical society: MyGate's average is about 200-230)48-10666-136106-286
500 homes120-265165-340264-716

Our calculation, FY26: the 100-home figures times the number of homes.

Sources: 4, 5, 9, 14

Or work it out for your own society:

Work it out for your society

Normal day

E-commerce parcels24-53
Quick-commerce and food orders33-68

Festive peak day

Parcels53-143

Storage slots at peak, if parcels wait

Half a day26-72
1 day53-143
2 days106-286
3 days158-429

Visits to the gate, normal day

Rider visits, one order per trip33-68
Courier visits, 1 parcel per trip24-53
Courier visits, 2 parcels per trip12-27
Courier visits, 3 parcels per trip8-18

Our calculation, FY26 (April 2025 to March 2026), India's cities of more than a million people. Slots are parcels held at once on a festive peak day, by how long each parcel waits before collection.

Sources: 4, 5, 12

Each range is a 95% range from one joint calculation: it allows for the survey's sampling error, for the city average anywhere in its range and for premium anywhere between the survey and MyGate, and in every case the kinds of home add up to the city total (12). That constraint is what keeps the rows narrow: if premium homes take more, the others must take less.

Parcels still lead nationally, but in big cities riders have drawn level

Across India, e-commerce parcel shipments outnumbered quick-commerce and food orders combined by about 2.3 to one in FY25 (22), and by about two to one in FY26 (1). In big cities the lead has gone, because the two streams are spread very differently.

Nationally, Redseer (an Indian consulting firm that sizes logistics markets) counts about 7 billion parcel shipments in FY25 (17). Quick commerce and food together came to roughly 2.9-3.3 billion orders: Redseer's 1.1-1.3 billion quick-commerce shipments plus its 1.8-2.0 billion food delivery shipments (15, 22, 23). In FY26, with parcels up 20-30% and company order counts for quick commerce and food, the national ratio is down to about 1.7-2.4 (1).

The big-city picture is different:

  • Parcels reach every part of the country. Redseer puts 62% of shipments in smaller cities and towns, which leaves about 38% for big cities (24).
  • Quick commerce and food are concentrated. About 80% of quick commerce and 70-80% of food delivery sits in the largest cities (15, 25, 26).

Quick commerce lives in eight cities; parcels go everywhere

Arunachal PradeshAssamChandigarhKarnatakaManipurMeghalayaMizoramNagalandPunjabRajasthanSikkimTripuraUttarakhandTelanganaBiharKeralaMadhya PradeshAndaman & NicobarGujaratLakshadweepOdishaDadra and Nagar Haveli and Daman and DiuJammu & KashmirChhattisgarhDelhiGoaHaryanaHimachal PradeshJharkhandTamil NaduUttar PradeshWest BengalAndhra PradeshPuducherryMaharashtraLadakhSholapur: 997,281 peopleChandigarh: 970,602 peopleTiruppur: 963,173 peopleGuwahati: 962,334 peopleHubballi: 943,788 peopleMysuru: 920,550 peopleSalem: 917,414 peopleBhubaneswar: 885,363 peopleJalandhar: 868,929 peopleKanayannur: 851,406 peopleThiruvananthapuram: 788,271 peopleAlīgarh: 753,207 peopleBareilly: 745,435 peopleMorādābād: 721,139 peopleWarangal: 704,570 peopleGorakhpur: 674,246 peopleGuntur: 670,073 peoplePuducherry: 657,209 peopleAmravati: 647,057 peopleBikaner: 644,406 peopleKochi: 633,553 peopleBhilai: 627,734 peopleCuttack: 610,189 peopleBhavnagar: 605,882 peopleSāngli: 601,214 peopleJamnagar: 600,943 peopleJammu: 576,198 peopleBokāro: 564,319 peopleNanded: 550,564 peopleKozhikode: 550,440 peopleKolhāpur: 549,236 peopleNellore: 547,621 peopleKalaburagi: 543,147 peopleAjmer: 542,321 peopleDehradun: 522,081 peopleErode: 521,891 peopleDurgapur: 518,872 peopleSiliguri: 515,574 peopleUjjain: 515,215 peopleBilimora: 510,879 peopleĀsansol: 504,271 peopleMangaluru: 499,487 peopleBelagavi: 490,045 peopleSahāranpur: 484,873 peopleVellore: 484,690 peopleMalegaon: 481,228 peopleGaya: 474,093 peopleJalgaon: 460,228 peopleKurnool: 460,184 peopleRāmgundam: 452,261 peopleUdaipur: 451,100 peoplePatiāla: 446,246 peopleDavangere: 435,128 peopleAkola: 428,857 peopleKorba: 419,146 peopleJhānsi: 412,927 peopleThoothukudi: 410,760 peopleBallari: 410,445 peopleBhāgalpur: 400,146 peopleAgartala: 400,004 peopleGauriganj: 390,395 peopleKākināda: 384,182 peopleLatur: 382,940 peopleRajamahendravaram: 376,333 peopleDhule: 375,559 peopleRohtak: 374,292 peopleAhilyanagar: 367,140 peopleKollam: 367,107 peopleBilāspur: 365,579 peopleBhilwara: 359,483 peopleBrahmapur: 356,598 peopleMuzaffarpur: 354,462 peoplePunāsa: 350,000 peopleMuzaffarnagar: 349,706 peopleKadapa: 344,893 peopleMathura: 330,511 peopleChānda: 328,351 peopleVijayapura: 327,427 peopleShivamogga: 322,650 peopleAlwar: 322,568 peopleShāhjānpur: 320,434 peopleJūnāgadh: 319,462 peopleThrissur: 315,957 peopleNizāmābād: 311,152 peopleTumkūr: 307,359 peopleParbhani: 307,170 peopleHisar: 307,024 peopleFīrozābād: 306,409 peopleKulti: 305,405 peopleKarnāl: 302,140 peopleBarddhamān: 301,725 peopleGundupālaiyam: 300,104 peopleMulugu: 297,671 peopleBihār Sharīf: 297,268 peopleRāmpur: 296,418 peopleDarbhanga: 296,039 peoplePanipat: 295,970 peopleTirupati: 295,323 peopleAizawl: 293,416 peopleDindigul: 292,512 peopleThanjavur: 291,067 peopleKarīmnagar: 289,821 peopleDewas: 289,550 peopleSonīpat: 289,333 peopleIchalkaranji: 287,353 peopleBathinda: 285,788 peopleJālna: 285,577 peopleSatna: 282,977 peoplePurnia: 282,248 peopleImphal: 277,196 peopleSaugor: 274,556 peopleKushinagar: 274,403 peopleRourkela: 273,317 peopleDurg: 268,806 peopleAnantapur: 267,161 peopleRatlām: 264,914 peopleRānipet: 264,330 peopleArrah: 261,430 peopleGajuwaka: 258,944 peopleEtāwah: 257,448 peopleBharatpur: 252,838 peopleBegusarai: 252,008 peopleGāndhīdhām: 247,992 peopleMau: 246,050 peopleSīkar: 244,497 peopleRamagundam: 242,979 peopleHāpur: 242,920 peopleFarrukhābād: 241,152 peopleAlappuzha: 240,991 peopleKatihar: 240,838 peopleSri Ganganagar: 237,780 peopleRewa: 235,654 peopleSivakasi: 234,704 peopleKarur: 234,191 peopleRāichūr: 234,073 peopleOoty: 233,426 peoplePāli: 230,075 peopleVizianagaram: 228,720 peopleNadiād: 225,071 peopleNāgercoil: 224,849 peopleMango: 223,805 peopleMurwāra: 221,883 peopleKanchipuram: 221,715 peopleSingrauli: 220,257 peopleMirzāpur: 220,029 peopleKharagpur: 219,665 peopleEluru: 218,020 peopleYamuna Nagar: 217,071 peopleRaurkela Industrial Township: 216,410 peopleBidar: 216,020 peopleMunger: 213,303 peopleNandyāl: 211,424 peoplePanchkula: 211,355 peopleBurhānpur: 210,886 peopleMorvi: 210,451 peopleAnand: 209,410 peopleOngole: 208,344 peopleHosapete: 206,167 peopleDeoghar: 203,123 peopleChāpra: 202,352 peopleKhandwa: 200,738 peoplePuri: 200,564 peopleMorena: 200,482 peopleGyānpur: 200,000 peopleBulandshahr: 198,612 peopleBhind: 197,585 peopleKhammam: 196,283 peopleSambhal: 196,109 peopleBhiwāni: 196,057 peopleAmbāla: 195,153 peopleKumarapalayam: 195,071 peopleMachilīpatnam: 192,827 peopleMahesāna: 190,753 peopleMahbūbnagar: 190,400 peopleSambalpur: 189,366 peopleBhusawal: 187,421 peopleRaebareli: 186,433 peopleHaridwar: 186,079 peoplePhusro: 185,555 peopleAdoni: 184,625 peopleSūjāngarh: 183,808 peopleSirsa: 182,534 peopleDinapur Nizamat: 182,429 peopleBahraigh: 182,218 peopleKāraikkudi: 181,851 peopleGuna: 180,935 peopleBaharampur: 180,547 peopleShahuwadi: 180,322 peopleMadanapalle: 180,180 peopleShivpuri: 179,977 peopleSurendranagar: 179,628 peopleNeyveli: 179,150 peopleSilchar: 178,865 peopleProddatūr: 177,797 peopleAmroha: 176,253 peopleChhindwāra: 175,052 peopleBhetia: 174,355 peoplePathānkot: 174,306 peopleCuddalore: 173,636 peopleShimla: 173,503 peopleGadag-Betageri: 172,813 peopleGadag: 172,612 peopleVerāval: 171,121 peopleNavsari: 171,109 peopleHaldia: 170,695 peopleRāiganj: 170,252 peopleMalda: 170,039 peopleJaunpur: 169,572 peopleBharūch: 169,007 peopleHoshiārpur: 168,653 peopleJīnd: 167,592 peopleKumbakonam: 167,155 peopleMohali: 166,864 peopleFatehpur: 166,480 peopleTonk: 165,294 peopleUdupi: 165,000 peopleThenali: 164,937 peopleSītāpur: 164,435 peopleBhadrāvati: 163,903 peopleVapi: 163,630 peopleMoga: 163,397 peopleRāj-Nāndgaon: 163,114 peopleRobertsonpet: 162,230 peopleUnnāo: 161,671 peopleBudaun: 161,555 peopleChittoor: 160,722 peopleJāmuria: 160,242 peopleJaigaon: 158,664 peopleBatāla: 158,621 peopleOrai: 158,265 peopleSaharsa: 156,540 peopleVidisha: 155,951 peopleHanumāngarh: 155,687 peopleThānesar: 155,152 peopleHassan: 155,006 peopleKishangarh: 154,886 peopleRudrapur: 154,554 peopleNalgonda: 154,326 peopleHazāribāgh: 153,595 peopleMedinīpur: 153,349 peopleBālurghāt: 153,279 peopleFyzābād: 153,047 peopleDinapore: 152,940 peoplePorbandar: 152,760 peopleBānda: 152,218 peopleHindupur: 151,677 peopleBeāwar: 151,152 peopleAnantnag: 150,592 peopleRaigarh: 150,019 peopleShāntipur: 149,983 peopleBhuj: 148,834 peopleHājīpur: 147,688 peopleSasarām: 147,408 peopleBhimavaram: 146,961 peopleBeed: 146,709 peopleKrishnanagar: 145,926 peopleChitradurga: 145,853 peopleDibrugarh: 145,488 peopleAbohar: 145,302 peopleTiruvannamalai: 145,278 peopleKaithal: 144,915 peopleBalasore: 144,373 peopleGodhra: 143,644 peopleShillong: 143,229 peopleRewāri: 143,021 peopleBasirhat City: 143,007 peopleChhatarpur: 142,128 peopleMandsaur: 141,667 peopleChas: 141,640 peoplePālanpur: 141,592 peopleLakhīmpur: 140,223 peopleValsād: 139,764 peopleDamoh: 139,561 peopleHaldwani: 139,497 peopleKolār: 138,462 peopleSrikakulam: 137,944 peopleMandya: 137,358 peopleMadhurampur Dehri: 137,231 peopleDimāpur: 135,860 peopleMāler Kotla: 135,424 peopleSiwān: 135,066 peopleBānkura: 133,966 peoplePātan: 133,737 peopleGondā City: 133,583 peopleDhaulpur: 133,075 peopleGondiā: 132,813 peoplePalakkad: 132,728 peopleBettiah: 132,209 peoplePalwal: 131,926 peopleRānīganj: 131,261 peopleEtah: 131,023 peoplePīlibhīt: 131,008 peopleRajapalayam: 130,442 peopleBotad: 130,327 peopleDeoria: 129,570 peopleNimach: 128,561 peopleYavatmāl: 128,175 peopleKhanna: 128,137 peopleHāthras: 126,882 peopleJorhat: 126,736 peopleLalitpur: 126,475 peopleGuntakal: 126,270 peoplePithampur: 126,200 peopleMothīhāri: 126,158 peopleKanhangad: 125,564 peopleJagdalpur: 125,463 peopleJagādhri: 124,894 peopleDārjiling: 123,797 peopleKurichchi: 123,667 peopleHardoī: 122,635 peoplePuruliya: 122,533 peopleDharmavaram: 121,874 peopleNagaon: 121,628 peopleVejalpur: 121,610 peopleChikmagalūr: 121,484 peopleBhadrak: 121,338 peopleSawai Madhopur: 121,106 peopleAmbikāpur: 121,071 peopleSatara: 120,195 peopleChūru: 120,157 peopleGangāpur: 120,115 peopleDohad: 118,846 peopleBarshi: 118,722 peopleĀdilābād: 118,526 peopleJhunjhunūn: 118,473 peopleJetpur: 118,302 peopleGudivāda: 118,167 peopleBārān: 117,992 peopleNarmadapuram: 117,988 peopleAmreli: 117,967 peoplePudukkottai: 117,630 peopleNarasaraopet: 117,489 peopleBaripāda: 116,849 peopleMuktsar: 116,747 peopleAzamgarh: 116,644 peopleBarnāla: 116,449 peopleChittorgarh: 116,406 peopleTinsukia: 116,322 peopleKhargone: 116,150 peopleBastī: 115,115 peopleGangavati: 114,642 peopleAmbur: 114,608 peopleGiridih: 114,533 peopleWardha: 113,759 peopleTadepalligudem: 112,655 peopleChanduasi: 112,635 peopleBagaha: 112,634 peopleAchalpur: 112,311 peopleGondal: 112,197 peopleDharashiv: 112,085 peoplePort Blair: 112,050 peopleBagalkot: 111,933 peopleSuriāpet: 111,729 peopleBangaon: 111,693 peopleDeesa: 111,160 peopleNavadwīp: 111,123 peopleNandurbar: 111,037 peopleSultānpur: 110,368 peopleFirozpur: 110,313 peoplePandit Deen Dayal Upadhyaya Nagar: 109,650 peopleSehore: 109,118 peopleKanpur Cantonment: 108,534 peopleTadpatri: 108,171 peopleJalpāiguri: 107,832 peopleMangalagiri: 107,197 peopleRanebennur: 106,406 peopleKhurja: 105,909 peopleKishanganj: 105,782 peoplePonnāni: 105,512 peopleHindaun: 105,452 peopleJamālpur: 105,434 peopleNāgaur: 105,218 peopleAmbala Sadar: 104,974 peopleBhiwadi: 104,921 peopleBūndi: 104,919 peopleMiryalaguda: 104,918 peopleSoyībug: 104,000 peopleJagtiāl: 103,930 peopleRoorkee: 103,894 peopleUdgīr: 103,550 peopleNagda: 103,501 peopleBetūl: 103,330 peopleJahānābād: 103,202 peopleKashipur: 103,138 peopleGhazīpur: 103,095 peopleAmaravati: 103,000 peopleNagapattinam: 102,905 peopleBuxar: 102,861 peopleMormugao: 102,345 peopleSeoni: 102,343 peopleAurangābād: 102,244 peopleHinganghāt: 101,805 peopleDhamtari: 101,677 peopleChilakalūrupet: 101,398 peopleMalappuram: 101,386 peopleBānswāra: 101,017 peopleItārsi: 100,574 peopleVasco da Gama: 100,485 peopleGangtok: 100,286 peopleDatia: 100,284 peoplePhagwāra: 100,146 peopleSurat: 4,591,246 peopleJaipur: 3,046,163 peopleKanpur: 2,823,249 peopleLucknow: 2,472,011 peopleNagpur: 2,405,665 peopleCoimbatore: 2,136,916 peopleIndore: 1,994,397 peopleVadodara: 1,822,221 peopleBhopal: 1,798,218 peoplePatna: 1,684,297 peopleLudhiana: 1,618,879 peopleNashik: 1,486,053 peopleMadurai: 1,465,625 peopleTirunelveli: 1,435,844 peopleAgra: 1,430,055 peopleRājkot: 1,390,640 peopleJamshedpur: 1,339,438 peopleMeerut: 1,223,184 peopleSrinagar: 1,206,419 peopleDhanbad: 1,196,214 peopleAurangabad: 1,175,116 peopleVaranasi: 1,164,404 peopleAmritsar: 1,159,227 peopleVijayawada: 1,143,232 peopleRanchi: 1,120,374 peopleJabalpur: 1,081,677 peoplePrayagraj: 1,073,438 peopleVisakhapatnam: 1,063,178 peopleJodhpur: 1,056,191 peopleGwalior: 1,054,420 peopleRaipur: 1,027,264 peopleTiruchirappalli: 1,022,518 peopleKota: 1,001,694 peopleDelhi: 11,034,555 peopleThāne: 1,841,488 peoplePimpri-Chinchwad: 1,727,692 peopleFaridabad: 1,414,050 peopleKalyān: 1,262,255 peopleDombivali: 1,247,327 peopleVirār: 1,222,390 peopleGhāziābād: 1,199,191 peopleHowrah: 1,027,672 peopleGurugram: 886,519 peopleBhiwandi: 874,032 peopleBhayandar: 809,378 peopleNarela: 800,000 peopleBorivli: 609,617 peopleUlhasnagar: 516,584 peopleLoni: 516,082 peopleBhātpāra: 483,129 peopleModīnagar: 475,843 peopleAmbattur: 466,205 peopleMaheshtala: 448,317 peopleShyamnagar: 441,956 peopleRajpur Sonarpur: 424,368 peoplePānihāti: 378,705 peopleAvadi: 345,996 peopleKukatpally: 341,709 peopleKāmārhāti: 332,965 peopleBārāsat: 298,127 peopleBāli: 296,973 peopleGreater Noida: 293,908 peopleNoida: 293,908 peopleGandhinagar: 292,797 peopleKirāri Sulemānnagar: 283,211 peopleLal Bahadur Nagar: 261,987 peopleAmbarnath: 253,475 peopleNaihāti: 253,221 peopleTiruvottiyūr: 249,446 peopleUluberiya: 235,345 peoplePallāvaram: 233,984 peopleHosūr: 229,528 peopleShrīrāmpur: 226,317 peopleQuthbullapur: 225,816 peopleNāngloi Jāt: 205,596 peopleSecunderabad: 204,182 peopleBhālswa Jahangirpur: 197,148 peoplePanvel: 195,373 peopleSopāra: 184,664 peopleSultan Pur Majra: 181,554 peopleChandannagar: 180,623 peopleHugli: 177,005 peopleHashtsāl: 176,877 peopleTambaram: 174,787 peopleBadlapur: 174,226 peopleBahadurgarh: 170,767 peopleDeoli: 169,122 peopleMadhyamgram: 161,126 peopleDalūpura: 154,791 peopleSerilingampalle: 150,525 peopleMalkajgiri: 150,000 peopleBārākpur: 148,174 peopleBurāri: 146,190 peopleHābra: 139,297 peopleKānchrāpāra: 136,954 peopleKalol: 134,426 peopleKhardah: 128,346 peopleHālīsahar: 128,172 peopleTitāgarh: 127,751 peopleDam Dam: 122,719 peopleBhadreswar: 121,662 peopleMandoli: 120,417 peopleMadhavaram: 119,105 peopleUppal Kalan: 118,259 peopleRishra: 117,014 peopleYelahanka: 116,447 peopleBaidyabāti: 115,504 peopleAshoknagar Kalyangarh: 111,475 peopleDelhi Cantonment: 110,351 peopleBānsbāria: 108,474 peopleAiroli: 100,000 peopleDelhiMumbaiBengaluruHyderabadChennaiKolkataPuneAhmedabadDelhiAhmedabadKolkataMumbaiPuneHyderabadChennaiBengaluru

The 8 metros

~80%of quick-commerce sales value is in these 8 metros
62%of e-commerce parcel shipments are in smaller cities and towns
  • The 8 metros and nearby cities
  • Other cities over 1 million
  • Cities of 100,000 to 1 million

Quick commerce: Redseer, FY25, by value (26). Parcels: Redseer, FY24; smaller cities and towns are those outside the metros and other million-plus cities (24). Metros as usually defined in Indian market reports, with their suburbs (cities within 45 km); Redseer does not list its eight. Circles: every city of 100,000 people or more, sized by population; towns below that are not drawn.

Sources: 24, 26 · Boundaries: DataMeet (CC BY 4.0) · Cities: GeoNames (CC BY 4.0)

Applying those shares to the national counts puts big-city parcels at about 1.0-1.3 times quick-commerce and food orders combined in FY25 (22). On Redseer's lower parcel count, rider orders are already ahead. By FY26 the two are roughly level: big-city parcels are about 0.8-1.2 times rider orders (1).

Parcels still lead nationally; in big cities the two are level

Parcels for every quick-commerce or food order01231 = as many parcels as ordersAll IndiaBig citiesBase case, widest count (7 billion)2.1-2.5Lower parcel count (5 billion)1.5-1.8Higher rider count (3-4 billion)1.7-2.5Lower parcels, higher riders1.2-1.8FY26 estimate1.7-2.4Base case1-1.3Lower parcel count0.7-0.9FY26 estimate0.8-1.2

Our calculation, FY25 except the FY26 rows (parcels grown 20-30% from FY25: Redseer forecasts 23-27% a year; the low end allows for the market outside Meesho growing about 15%, as in FY25; quick-commerce orders from company counts; food orders up 13-20%, as at Swiggy and Zomato). Other FY25 rows swap in Redseer's lower parcel count (4.9-5.3 billion, which leaves out hyperlocal and grocery) or its higher rider count (3-4 billion on-demand local deliveries, in place of about 2.9-3.3 billion quick-commerce and food orders). Big cities = the 8 metros plus other cities above 1 million people. Each alternative moves the count toward riders; parcels still lead nationally in every case. Below 1, rider orders outnumber parcels.

Sources: 1, 15, 17, 18, 22, 23, 24, 25, 26, 27, 28

Rider orders are growing several times faster than parcels

The national lead is shrinking every year. FY24 to FY25 is the only year in which all three streams can be compared on volume, and quick commerce roughly doubled (23, 24).

Quick-commerce volumes grew several times faster than parcels or food in FY25

StreamMeasureFY24 → FY25Growth
E-commerce parcels, lower countRedseer shipments4.4 billion → 4.8-5.5 billion+9% to +25% (our arithmetic)
FoodZomato orders753 million → 853 million+13%
Quick commerceRedseer shipments (two reports)0.6 billion → 1.1-1.3 billion+83% to +117% (our arithmetic)
Sources: 16, 17, 23, 24, 29

Company figures show the pace continuing. Indian companies report by financial year, April to March. In FY26 the three largest quick-commerce platforms took about 2 billion orders between them (our calculation): Blinkit 916.6 million (32), Swiggy's Instamart 412.2 million (32) and Zepto about 640 million, a figure from press coverage of its draft prospectus (33). That is more than Redseer counted for the whole market a year earlier.

Quarter by quarter, one grocery app has now caught up with a national parcel network. At the end of 2023, Delhivery, a national parcel courier, shipped about 3.6 times as many parcels a quarter as Blinkit took orders: 201 million against 56 million (our calculation) (34, 35). In April-June 2026, Blinkit took 331 million orders (36). Delhivery shipped 322 million express parcels in the same quarter, even after buying a rival courier, Ecom Express, in July 2025 (37, 38). A year earlier, Delhivery shipped about 30 million more a quarter than Blinkit took orders (our calculation) (32, 39).

Blinkit now takes more orders a quarter than Delhivery ships parcels

ParcelsRiders0 M100 M200 M300 M400 MJul-Sep 2022Jul-Sep 2023Jul-Sep 2024Jul-Sep 2025Delhivery buys Ecom ExpressShadowfax: 80 MShadowfax: 102 MShadowfax: 184 MShadowfax: 198 MInstamart: 50 MInstamart: 55.9 MInstamart: 67.8 MInstamart: 73.2 MInstamart: 88.6 MInstamart: 92.4 MInstamart: 101 MInstamart: 106 MInstamart: 113 MInstamart: 114 MZepto: 167 MZepto: 210 MDelhivery: 161 MDelhivery: 170 MDelhivery: 182 MDelhivery: 181 MDelhivery: 201 MDelhivery: 176 MDelhivery: 183 MDelhivery: 185 MDelhivery: 206 MDelhivery: 177 MDelhivery: 208 MDelhivery: 246 MDelhivery: 295 MDelhivery: 306 MDelhivery: 322 MBlinkit: 55.8 MBlinkit: 78.8 MBlinkit: 93.2 MBlinkit: 110 MBlinkit: 142 MBlinkit: 177 MBlinkit: 223 MBlinkit: 243 MBlinkit: 274 MBlinkit: 331 MShadowfax 198 MInstamart 114 MZepto 210 MDelhivery 322 MBlinkit 331 M

Millions per quarter. Parcels (green): express parcel shipments, returns and reverse pickups included (Shadowfax: its express orders). Riders (dark): quick-commerce orders. Delhivery's jump from Jul-Sep 2025 includes Ecom Express volumes. Lines bridge quarters a company has not published; Zepto has published quarterly orders only for Oct-Dec 2025 and Jan-Mar 2026. Blinkit's Jul-Sep 2024 and Shadowfax's Jan-Mar 2025 are our arithmetic from yearly totals and growth rates. Food delivery is not shown: neither Swiggy nor Zomato publishes a quarterly food-order count.

Sources: 29, 32, 34, 35, 36, 37, 38, 39, 40, 41, 42, 43, 44, 45, 46, 47, 48, 49, 50, 51, 52

Delhivery is one carrier among several, so this is not a national comparison. What it shows is speed: Blinkit's orders nearly doubled in a year, while Delhivery's parcels, acquisition included, rose about 55% (36, 37). No FY26 national parcel count exists yet, but on our FY26 estimate riders and parcels are roughly level in the big cities (1).

Who comes to the gate more often: couriers or riders?

Orders are not visits. A rider usually brings one order; a courier may bring several parcels for the same building on one trip. In a gated society riders make most trips even if every courier brought only one parcel per visit, and the more parcels each courier visit carries, the wider the gap.

Of every 100 visits to a gated society's gate, riders make 53-80

Rider visitsCourier visitsRange of our estimate53.2-57.8%One parcel per courier visit69.4-73.3%Two parcels per courier visit77.3-80.4%Three parcels per courier visit

Scenario, our calculation, FY26. Gated-society mix (0.73-0.88 parcels to each quick-commerce or food order) applied to one society; one rider visit per order. Pale squares show the range.

Sources: 4, 12, 53

In a 100-home premium society that means about 24-53 courier visits a day at one parcel per trip, about 12-27 at two and about 8-18 at three, against about 33-68 rider visits (4). We found no published figure for parcels per courier visit, so we cannot say which panel is typical. One parcel per visit is the floor, so the first panel is the most courier-heavy case. If riders carry several orders to the same society, rider visits fall.

On the busiest day, parcels run at about two and a half times the average

For parcels, the festive quarter brings only a modest rise. The peak day brings a large one, and that is what a parcel store has to absorb.

Delhivery's festive quarter runs about a tenth above the rest

Festive quarter (Oct-Dec, Diwali)Other quarters0 M100 M200 M300 MApr-Jun 2023Jul-Sep 2023Oct-Dec 2023Jan-Mar 2024Apr-Jun 2024Jul-Sep 2024Oct-Dec 2024Jan-Mar 2025182 M182 M181 M181 M201 M201 M176 M176 M183 M183 M185 M185 M206 M206 M177 M177 M

Quarterly shipments, millions, April 2023 to March 2025, before the Ecom Express acquisition.

Source: 44

In its October-December quarter, Delhivery's express parcel volumes ran about 10-13% above the April-September quarters, in both 2023 and 2024 (44). But in the 2025 festive season it dispatched 7.2 million orders on its record day, roughly two and a half times an average day (21).

Delhivery's record festive day was 2.2-2.7 times an average day

0 M2 M4 M6 M8 MAverage day, Jul-Sep 20252.7 MAverage day, Oct-Dec 20253.2 MRecord day, 2025 festive season7.2 M

Millions per day. Average days are the quarter's express parcel shipments ÷ 92 days (our calculation); the record day is dispatched orders. The 2025 averages include Ecom Express volumes.

Sources: 21, 38, 45

For a single gate, the transferable figure is the ratio, not the 7.2 million. We assume a society's peak mirrors Delhivery's national one, because no gate-level peak is published. For quick commerce and food, any festive effect is lost in quarter-on-quarter growth.

Cutting the wait saves as much space as halving the parcels

A parcel store has to hold every parcel until its resident collects it, so the space it needs depends on two numbers: how many parcels arrive on the peak day, and how long each one waits. The second matters as much as the first. If parcels wait a day, a 100-home premium society holds 53-143 at once on a festive peak day; if they wait half a day, 26-72, the same saving as halving the parcel count (5).

If parcels wait a day, a 100-home premium society needs 53-143 slots at peak

parcels held0200400600Half a day26.4-71.61 day52.8-1432 days106-2863 days158-429

Scenario, our calculation, FY26, premium society. Peak-day parcels times the average days a parcel waits before collection, which is unmeasured in India.

Source: 5

A building cannot choose how many parcels its residents order, but it can shorten the wait: notify residents the moment a parcel arrives, and let them collect at any hour. We found no published measure of how long parcels wait at Indian society gates.

What it means for a building

Gate handoff. In a premium society, plan for more rider visits than courier visits: riders bring more orders than couriers bring parcels, and a courier can combine several parcels in one visit. Riders hand over directly and need a fast, sheltered handoff point rather than storage. No published figure gives riders per hour at a gate, so the busiest hour has to come from a gate log.

Parcel storage. Size the parcel store for peak-day parcels times the expected wait (previous section). Shortening the wait is the lever a building controls.

Rules. Indian rules offer little help. Karnataka's bye-laws require only an office-cum-letter-box room of 10-40 sq m, depending on flat count (54). The national model bye-laws contain no parcel or rider provision that we could find (55). Elsewhere, the US Postal Service requires one parcel locker for every five mailboxes in new apartment buildings (56), and Changshu in China sets minimum parcel-room areas that scale with development size (57).

Logistics operators hold the missing number: parcels per courier visit. Publishing even a big-city average would settle who dominates the gate. Investors should watch how far quick commerce spreads beyond the metros: metros already account for only about 60% of its growth in sales value (2).

The objection: the totals may be off, returns inflate parcels, and visits are the wrong unit

The strongest alternative reading has three parts. The choice of totals can be tested; the point about returns has to be conceded; the point about visits is partly conceded.

Which total. Redseer's FY25 e-commerce totals differ between reports, at 6.8-7.4 billion, 4.8-5.5 billion and 4.9-5.3 billion, with no published reconciliation (15, 16). Swapping in the lower parcel count or Redseer's larger 3-4 billion count of local deliveries (27) narrows the national lead but never reverses it; the range chart shows every case. If the 6.8-7.4 billion count included local deliveries, our base case would double-count; Redseer's wording points against that, but its footnote does not settle it (16, 17).

Returns. Both Redseer parcel series count returns and reverse pickups (15, 17), and no usable figure gives their share. Some belong in a gate count anyway, because a pickup still brings a courier to the gate. On the rider side, Zomato's order count includes cancelled orders, which bring no one (58).

Visits are the wrong unit for sizing space. A parcel has to be held until the resident collects it; a rider hands food or groceries over directly. We concede this in part. The visit count sets how busy the gate is and how much handoff space riders need. It says nothing about the size of a parcel room, which depends on peak-day parcels and how long they wait, as the storage chart shows (5).

How we did this

Sources. Redseer's industry reports in the Meesho and Shadowfax IPO documents and its other published reports (FY24-FY26), including its 2021 and 2026 reports on gated communities; Eternal, Swiggy and Delhivery filings and shareholder letters (FY19-FY27); Zepto's June 2026 draft prospectus and Meesho's FY26 results, via press coverage; MyGate's site and its chief executive's statements, via Business Today and The Ken; Bain's 2023 survey; the 2011 Census, the 2018 National Sample Survey, the 2019-21 National Family Health Survey (NFHS-5) and the National Sample Survey's 2025 telecom survey (household online purchases, unit-level data). All calculations are ours: a source that reads "Our calculation" in the Sources list marks them, and the "How we got this" boxes set them out.

Big-city shares. The shares come from different years and city groups (top 8, top 10 and top 60 cities), and Redseer does not say whether a parcel is counted where it is sent or where it is delivered (24). The biases pull both ways. The quick-commerce shares cover only the top 8 or 10 cities, which favours riders; but they are measured by value, and if big-city orders are larger, value shares overstate order shares, which favours parcels.

Homes behind gates. The 2018 National Sample Survey found 56.4% of urban households had an independent house, so a little under half live in shared buildings (59). Its definition of a flat is far broader than a gated society (60), and the share varies widely by state (60).

Kinds of home. Shares of homes come from Redseer (6, 7), the 2011 Census (10) and MyGate, which describes its societies as premium households (9); orders by kind of home come from the National Sample Survey's 2025 telecom survey (11). Its limits: it records spending, not the type of home, so spending per person stands in for it (a well-off family in an old bungalow counts as premium); it covers goods only, in January-March 2025; and people recall fewer orders than they place, so it gives the gradient and the city totals give the level (12). Household size comes from NFHS-5 (20).

What would change the result: gate logs split by stream, above all from ordinary gated societies; a survey that records the type of home along with online orders; parcels per courier visit; a reconciled Redseer FY25 total; the share of returns; a FY26 national parcel count; the time parcels wait at Indian society gates before collection; and a reconciliation of Redseer's food count with the platforms' own order counts.

About this research. LAIA Observatory and Parcely are both part of LAIA Stem. Parcely designs in-building delivery systems. Every figure here comes from public filings, industry reports and official statistics; the calculations are ours and are set out in the "How we got this" boxes.

Sources

1. Our calculation from sources 3, 15, 17, 18, 28, 32, 33 and 61, FY26
2. Redseer: Speed in Metro, Scale in Bharat (May 2026); Redseer x Google: Think Quick Commerce, FY26: https://redseer.com/articles/speed-in-metro-scale-in-bharat-indias-80-bn-online-retail-story/

3. Our calculation from sources 15, 16, 17, 18, 24, 25, 26, 28, 29, 30, 32, 33 and 61, FY26

4. Our calculation from sources 3, 6, 7, 9, 10, 11, 12, 13, 19 and 20, FY26

5. Our calculation from sources 4 and 21, FY26

6. Redseer: Your next high-paying consumer isn't scrolling. They're living here, 2026: https://redseer.com/articles/your-next-high-paying-consumer-isnt-scrolling-theyre-living-here/

7. Redseer: Gated community, a $500B consumption story in 2026, 2021 (projection to 2031): https://redseer.com/wp-content/uploads/2021/11/gatecommunity-211110065843.pdf

8. Storyboard18: India's gated communities to hit $900B consumption by FY2031 (Redseer), FY2031 (projection, reported 11 Mar 2026): https://www.storyboard18.com/advertising/indias-gated-communities-to-hit-900b-consumption-by-fy2031-redseer-ws-l-91876.htm

9. MyGate: company site and ad platform pages, 2026: https://mygate.com/ad-platform/

10. Tripathi (ICRIER), Determinants of large city slum incidence in India, MPRA paper 57239 (Census 2011 data), 2011: https://mpra.ub.uni-muenchen.de/57239/1/MPRA_paper_57239.pdf

11. MoSPI, NSS 80th round: Comprehensive Modular Survey: Telecom 2025, unit-level data (microdata.gov.in catalogue 239, file CMST80HH), 2025: https://microdata.gov.in/NADA/index.php/catalog/239

12. Our calculation from sources 11, 2025

13. Business Today: Checkpoint (Coolest Start-ups 2019), quoting MyGate CEO Vijay Arisetty, 2019: https://businesstoday.in/magazine/coolest-start-ups-2019/checkpoint/story/358486.html

14. The Ken: Nobroker wanted to eat Mygate's lunch. But housing societies had other ideas, c. 2023-24 (article date not shown in result): https://the-ken.com/story/nobroker-wanted-to-eat-mygates-lunch-but-housing-societies-had-other-ideas/

15. Redseer Strategy Consultants: Industry Report: India 3rd Party Logistics Market (Shadowfax offer document), FY2025: https://www.shadowfax.in/investor-relations/offer-documents/shadowfax_india_3rd_party_logistics_market_industry_report.pdf

16. Redseer Strategy Consultants: Express Logistics in Motion: Market Update & Outlook (PDF), FY24-FY25: https://redseer.com/wp-content/uploads/2025/03/India-Express-Logistics-Marketl.pdf

17. Redseer Strategy Consultants: Industry Report in Meesho IPO documents (Chapter 2), FY2025 (Apr 2024-Mar 2025): https://investor.meesho.com/investor-web/_next/docs/ipo/industry-report-e-com.pdf

18. Medianama: Meesho posts Rs 166 crore loss in Q4 FY26, revenue jumps 47% (from Meesho's Q4 FY26 results), FY26: https://www.medianama.com/2026/05/223-meesho-posts-rs-166-crore-loss-q4-fy26-revenue-jumps-47/

19. World Bank: World Development Indicators, EN.URB.MCTY (Population in urban agglomerations of more than 1 million), India, 2025: https://api.worldbank.org/v2/country/IND/indicator/EN.URB.MCTY?format=json&date=2019:2025

20. IIPS and ICF, National Family Health Survey (NFHS-5), 2019-21: India report, Table 2.14, 2019-21: https://dhsprogram.com/pubs/pdf/FR375/FR375.pdf

21. Delhivery: Letter to Shareholders Q2FY26, 2025 (Sep-Oct festive season): https://www.delhivery.com/uploads/2025/11/LettertoShareholders_Q2FY26.pdf

22. Our calculation from sources 15, 17, 23, 24, 25 and 26, FY25-FY26

23. Shadowfax Technologies: Annual Report FY2024-25 (citing Redseer research), FY2025: https://www.shadowfax.in/sfx_fy25/Shadowfax_Annual_Report_FY24-25.pdf

24. Redseer Strategy Consultants: Capturing the Growth Potential in India's 3PL Market (city-tier shipment data also in Redseer's B2C E-Commerce Logistics Market industry report, Aug 2024), FY2024 (Redseer report published 2024-25): https://redseer.com/reports/capturing-the-growth-potential-in-indias-3pl-market/

25. Bain & Company: How India Shops Online 2023, 2022-23: https://www.bain.com/insights/how-india-shops-online-2023/

26. Redseer Strategy Consultants: Scaling Quick Commerce Beyond Metros: A Strategic Reassessment (supporting FY24 figure: Redseer: India's Q-Commerce Ascent: A New Era in Shopping), FY24-FY25: https://redseer.com/articles/scaling-quick-commerce-beyond-metros-a-strategic-reassessment/

27. Redseer: Wheels of the last-mile: How E2W rentals are powering India's hyperlocal logistics boom, FY2025: https://redseer.com/articles/wheels-of-the-last-mile-how-e2w-rentals-are-powering-indias-hyperlocal-logistics-boom/

28. Eternal Ltd: Shareholders Letter, Q4 FY26 results (28 Apr 2026), FY26: https://b.zmtcdn.com/investor-relations/Eternal_Limited_Shareholders_Letter_Q4FY26_Results.pdf

29. Medianama: Annual Report 2024-25: Eternal's Revenue Soars 67%, Profit Up by 50% (reporting Eternal Ltd's FY25 Annual Report), FY25 (April 2024 to March 2025): https://www.medianama.com/2025/07/223-eternal-fy25-annual-report-highlights-zomato-blinkit/

30. Swiggy: Q3 FY2026 Shareholders' Letter (Quick-commerce table); Swiggy Annual Report FY26 (via BSE filing), FY26: https://www.bseindia.com/xml-data/corpfiling/AttachHis/fbc15e07-228a-492d-b97c-bd4fb9b368e1.pdf

31. Competition Commission of India: Case No. 16 of 2021 (NRAI v. Zomato & Swiggy), prima facie order, 4 April 2022; no more recent authoritative order-share figure is published: https://www.cci.gov.in/images/antitrustorder/en/1620211652180990.pdf

32. HDFC Securities: Eternal Q4FY26 result note (from BSE filings), FY26 (April 2025 - March 2026): https://static.hdfcsky.com/wp-content/uploads/2026/04/Eternal-Q4FY26-29th-Apr26.pdf

33. Business Standard: Zepto pauses IPO, pre-IPO round (citing Zepto DRHP data), Q4FY26 / FY26: https://www.business-standard.com/amp/companies/news/zepto-pauses-ipo-to-raise-rs-1k-cr-in-pre-ipo-round-at-4-5-bn-valuation-126073001618_1.html

34. Delhivery: Q3 FY24 results press release, Q3FY24 (Oct-Dec 2023): https://www.delhivery.com/uploads/2024/02/PressRelease_Q3FY24.pdf

35. Medianama: Blinkit targets 2,000 stores by Dec 2025 (from Zomato's Q3 FY25 investor document), Q3FY25 (Oct-Dec 2024): https://www.medianama.com/2025/01/223-zomato-blinkit-2000-stores-rising-losses/

36. Eternal Q1 FY27 shareholder letter, as reported by YourStory, Q1FY27 (Apr-Jun 2026): https://yourstory.com/2026/07/eternal-rs-92-crore-net-profit-first-quarter-of-fy27

37. Delhivery: Q1 FY27 results press release, Q1FY27 (Apr-Jun 2026): https://www.delhivery.com/uploads/2026/08/PressRelease_Q1FY27.pdf

38. Delhivery: Q2 FY26 results press release, Q2FY26 (Jul-Sep 2025): https://www.delhivery.com/uploads/2025/11/PressRelease_Q2FY26.pdf

39. Delhivery: Q1 FY26 results press release, Q1FY26 (Apr-Jun 2025): https://www.delhivery.com/uploads/2025/08/PressRelease_Q1FY26.pdf

40. Delhivery: Q2 FY24 results press release, Q2FY24 (Jul-Sep 2023): https://www.delhivery.com/uploads/2023/11/PressRelease_Q2FY24.pdf

41. Delhivery: Q4 FY24 results press release, Q4FY24 (Jan-Mar 2024): https://www.delhivery.com/uploads/2024/05/PressRelease_Q4FY24.pdf

42. Delhivery: Q3 FY25 results press release, Q3FY25 (Oct-Dec 2024): https://www.delhivery.com/uploads/2025/01/PressRelease_Q3FY25.pdf

43. Delhivery: Q4 FY25 results press release, Q4FY25 (Jan-Mar 2025): https://www.delhivery.com/uploads/2025/05/PressRelease_Q4FY25.pdf

44. Motilal Oswal: Delhivery 3QFY26 Result Update, quarterly express parcel series (company data), FY24-FY25: https://bsmedia.business-standard.com/_media/bs/data/market-reports/equity-brokertips/2026-02/17700206560.57713700.pdf

45. Delhivery: Q3 FY26 results press release, Q3FY26 (Oct-Dec 2025): https://www.delhivery.com/uploads/2026/01/PressRelease_Q3FY26.pdf

46. Delhivery: Q4 FY26 results press release, Q4FY26 (Jan-Mar 2026): https://www.delhivery.com/uploads/2026/04/PressRelease_Q4FY26.pdf

47. Shadowfax Technologies: Q1 FY27 earnings presentation (NSE filing), Q1FY27 (Apr-Jun 2026): https://nsearchives.nseindia.com/corporate/9900590024_31072026130039_Earnings_Presentation.pdf

48. Inc42: Shadowfax posts Rs 56 Cr profit in Q4 (reporting the Q4 FY26 earnings presentation), Q4FY26 (Jan-Mar 2026): https://inc42.com/buzz/shadowfax-posts-%e2%82%b956-cr-profit-in-q4-revenue-jumps-74-yoy/

49. Entrackr: Breaking down Blinkit's growth by its numbers in Q1 FY25 (from Zomato's filings), Q1FY25 (Apr-Jun 2024): https://entrackr.com/2024/08/breaking-down-blinkits-growth-by-its-numbers-in-q1-fy25/

50. Swiggy: Q4 FY2025 shareholders letter (quick-commerce table), Q4FY24-Q4FY25: https://www.swiggy.com/corporate/wp-content/uploads/2025/05/Q4-FY2025-Shareholder-letter.pdf

51. Swiggy: Q1 FY27 Shareholders' Letter, quick commerce table (p.7), Q1FY26-Q1FY27: https://www.swiggy.com/corporate/wp-content/uploads/2026/07/Q1-FY2027-Shareholder-letter.pdf

52. Business Standard: Zepto files updated DRHP (citing UDRHP data); MoneyFlow India deep dive, Q3FY26-Q4FY26: https://www.business-standard.com/markets/ipo/zepto-files-drhp-for-rs-10000-crore-ipo-first-qcom-only-listing-126060900099_1.html

53. Our calculation from sources 4, FY26

54. Government of Karnataka (UDD): Karnataka Municipal Corporations Model Building Bye-Laws 2017, cl. 5.1.14 (notification dated 28-10-2017), 2017: https://bpas.bbmpgov.in/BPAMSClient4/Downloads/Bye%20laws%20and%20Zoning%20Regulations/Model%20Building%20Byelaws%20Notification%20No.%20UDD%2014%20TTP%202017%20(P-4)%20Bengaluru,%20Dated%2028-10-2017%20.pdf

55. MoHUA / TCPO: Model Building Bye-Laws 2016, 2016: https://mohua.gov.in/upload/uploadfiles/files/MBBL.pdf

56. USPS: Handbook PO-632, §5-1 Apartment Communities, current USPS handbook PO-632 (page undated): https://about.usps.com/handbooks/po632/po632_05_001.htm

57. Changshu Municipal People's Government General Office: Implementation opinion on encouraging parcel-service rooms in new residential areas (市政府办公室关于鼓励新建住宅区等场所设置快递服务用房的实施意见), 2017: https://www.changshu.gov.cn/zgcs/c108192/201711/b2fec8600fbd4d0fa02fa4a40ca24d87.shtml

58. Zomato: Annual Report 2021-22, FY22 report: https://b.zmtcdn.com/investor_relations_documents/zomato_annual_report_2022_1659701415938.pdf

59. PIB / MoSPI: NSS report no. 584: Drinking Water, Sanitation, Hygiene and Housing Condition in India, NSS 76th round, 2018 (NSS 76th round, July-Dec): https://pib.gov.in/Pressreleaseshare.aspx?PRID=1593252

60. Directorate of Economics & Statistics, Kerala: Report on NSS 76th Round (Concepts and Definitions), 2018 (same definition as the 69th round, 2012): https://www.ecostat.kerala.gov.in/storage/publications/630.pdf

61. Storyboard18: India's express logistics market to hit 24-29 billion shipments by FY2030 (Redseer), FY2024-FY2030: https://www.storyboard18.com/how-it-works/indias-express-logistics-market-poised-for-rapid-growth-to-hit-24-29-billion-shipments-by-fy-2030-redseer-report-60997.htm